2021年3月16日 星期二

Cardano (ADA) Scores Bloomberg Terminal Listing

 https://www.investing.com/news/cryptocurrency-news/cardano-ada-scores-bloomberg-terminal-listing-2448155


  • Cardano (ADA) is now listed on the Bloomberg Terminal
  • ADA ranks fifth place on the market capitalization among all cryptocurrencies

According to recent reports, Cardano (ADA) has added to the Bloomberg Terminal. The platform is utilized by expert traders. Consequently, this will expose ADA to a new wave of potential investors.

A few days before Bloomberg Terminal added Cardano, Galaxy Digital CEO Mike Novogratz asked whether his Twitter followers could make a bull case for ADA. “Does anyone build on it? Use it? Why is the market cap so high?” he wrote, adding, “Should it be a funding asset? It’s one of the few cryptos I haven’t traded in my life.”

Cardano is a peer-reviewed blockchain that utilizes the native token ADA. Despite the news, ADA is still following the broader crypto market’s downtrend. The token has fallen by almost 5% in the last 24 hours and 9.5% in the previous seven days.

However, since the start of 2021, ADA has surged greatly having opened the year at $0.18 but is currently sitting at $1.02.

According to Coinmarketcap, ADA ranks fifth by market cap among all cryptos with a total cap of $32 billion.

The Cardano roadmap is classified into five eras: Byron, Shelley, Goguen, Basho, and Voltaire. The Goguen phase aims to enable Cardano users to create and execute smart contracts on the ADA network. The phase recently started with the Mary hard fork.

In addition, Cardano has received investments from the likes of FD7 Ventures. FD7 Ventures has set aside $250 million to fund companies that are building solutions on Cardano and Polkadot.

Of note, the venture fund said it is bullish on the growing non-fungible token (NFT) industry. Thus, the firm decided to support companies building on platforms that enable decentralized finance (DeFi) solutions.

2021年3月15日 星期一

Who remembers 2013? Bitcoin’s First Amazing Bull Run

 https://www.newsbtc.com/news/remember-2013-bitcoin-first-amazing-bull-run/#:~:text=In%20April%202013%20it%20continueditst,opened%20at%20%24194.42%20per%20coin.


For me, 2013 has long stayed in my memory as a year that affected me personally – a year where one key event happened which impacted me directly.  Looking back on it now though it seems that history has repeated itself.

Firstly, though he wasn’t a new President, Obama was sworn in for his second term in the White House and once again this year we saw a new POTUS take charge.  Secondly, we also had a North Korean nuclear test that year, causing outrage but not to the extent that leads to the heated exchanges of words which we saw this year. We also had a number of catastrophic storms back in 2013 with the tornado in Moores, Oklahoma being particularly devastating.

But there were two things in particular that come to mind that are a carbon copy of 2013, one is the ever-approaching potential shut down of the US Government in December and the second is the incredible bull run of bitcoin.

2013- The “Year of The Bitcoin”

In 2013, the now infamous cryptocurrency was only 5 years old, but this was the time it first started to gain real attention from the market.  In January 2013, Bitcoin was trading around $12.15 per coin and had yet to show up on anyone’s radar. Then a financial crisis occurred in March which kick-started an incredible run for the remainder of the year.

In March 2013 a financial crisis gripped the small Mediterranean island of Cyprus, where the country needed to request $13billion bailout from the European Union and the International Monetary fund.  However, the terms of the rescue package were that Cyprus Central Bank had to raise $7.5 billion by taxing bank deposits. Cash restrictions on the populous were implemented to avoid a potential bank run and large depositors ended up losing as much 10% of their held capital. One of the major retail banks was forced to close and banks across the country followed suit for a number of weeks. Living in Cyprus as I do, and did at the time, this period was no pleasant experience.

An Alternative?

Despite Cyprus only having a population of under 1 million, these events caught the attention of the media all over the globe and was in many a headline. But it also caused people to take note of the potential of bitcoin.  Due to what had happened with the Cypriot Banks, bitcoin started to gain in popularity due to the fact that it was unregulated, and no government or bank could touch it. At the beginning of March, that year Bitcoin was already outperforming most traditional currencies and trading at around $32.20 per coin, by the end of March following the Cyprus crisis it has risen to $90.52 per coin.  In April 2013 it continueditst move higher, touching an all-time high of the time of $234.52. The following months it traded between at its lowest $66.83 and highest $196.24. Then suddenly in November 2013 it exploded. At the beginning of the month, Bitcoin opened at $194.42 per coin. By the end of the month it closed at a huge $1113.06 per coin. For the first time, 2013 was hailed the year of bitcoin.

It went on the following month to hit a new high of $1242 per coin due to increased demand from consumers in China until the Chinese Government finally decided that enough was enough and stepped in, barring all banks from handling bitcoin transactions. In the aftermath of the intervention, bitcoin collapsed the following year hitting a low of $100.91 per coin in August 2014.  However, this was the lowest it would drop to. From there, over the next two years it traded fairly evenly till January 2017 and, well, we all know what has happened since then.

Looking to the Future

Now the question to ask of course is will we see a repeat of what happened at the tail end of 2013?

First of all, like 2013 we have had further intervention by the Chinese authorities and other Governments, but as of yet it still hasn’t stopped this year’s incredible bull run. We have also seen many voices crying out “bubble” and “scam” but again bitcoin traders have brushed this off. The biggest difference between this year and 2013 is that despite the skeptics we are now seeing some real players in the market start to embrace Bitcoin, with the CME Group the latest exchange to announce its intention to launch bitcoin future contracts.

Will we have a reversal with bitcoin like we saw at the end of 2013? Only time for sure will tell but as long as the interest in this cryptocurrency continues, the chances that bitcoin could keep on rising will remain intact.

Bitcoin Plunges Below $55K Amid Weak Institutional Inflows, Profit Taking

 https://www.coindesk.com/bitcoin-plunges-below-55k-amid-weak-institutional-inflows


"This does not mean the bull run is over, it just means that profit taking is happening," according to market analyst Lark Davis."This does not mean the bull run is over, it just means that profit taking is happening," according to market analyst Lark Davis.

Bitcoin is losing altitude on Monday amid weak buying pressure from institutional investors. 

The crypto market leader fell as low as $54,790.33 Monday morning, having reached a record high of $61,556.59 on Saturday, according to CoinDesk 20 data. At press time, a small bounce to $55,786 was seen.

“The failure to establish a foothold above $60,000 and the decline is likely the result of the flat-to-negative Coinbase premium – a major bellwether for institutional demand,” according to Ki Young Ju, CEO of blockchain analytics firm CryptoQuant. 

CryptoQuant’s Coinbase premium indicator measures the spread between Coinbase’s BTC/USD pair and Binance’s BTC/USDT pair. A positive spread implies increased demand from high-net-worth investors and institutions, as these entities prefer to trade via regulated exchanges with over-the-counter desks such as Coinbase.

The premium was negative over the weekend when bitcoin broke above $60,000 and remains marginally positive at press time, implying weak institutional demand. 

Coinbase Premium
Source: CryptoQuant

The spread has been significantly higher previously as prices surged above the major psychological levels of $20,000, $30,000, $40,000, and $50,000. Bitcoin has charted a six-fold rally over the past six months mainly on the back of increased institutional participation

“I think [we’ll see bitcoin] short-term bearish or going sideways until there’s significant institutional spot inflows in Coinbase,” Ki said.

“Whale addresses holding 1,000 or more bitcoin have been selling, this does not mean the bull run is over, it just means that profit taking is happening,” according to market analyst Lark Davis.

Meanwhile, Patrick Heusser, head of trading at the Swiss-based Crypto Finance AG, says the latest pullback is healthy, as the breakout above $60,000 was mainly driven by leveraged traders. “The perpetual futures funding rate and futures premium was super stretched,” Heusser told CoinDesk. 

See also: Diginex Anticipating Bitcoin Rise to $175K by End of 2021, CEO Says

Joel Kruger, currency strategist at LMAX Digital, told CoinDesk an overextended market has pulled back on the back of more reports of a possible cryptocurrency ban in India.

Bitcoin may suffer a deeper drawdown in the short run if the U.S. bond yields continue to rise, destabilizing stock markets. Technical studies such as the weekly chart relative strength index are also warning of a notable price pullback.

However, the broader outlook remains bullish with the likes of Diginex CEO Richard Byworth predicting a rally to $175,000 by the end of 2021.

Why the UK inflation risk after lockdown is hard to assess

 https://www.ft.com/content/6925a0bb-f233-4a86-8556-6d03dee23dc0

Terry, who repairs bicycles in a basement workshop in north London, has been working flat out since recovering from a month-long bout of Covid-19 in January. The lockdown bike boom shows no sign of slackening. With manufacturers unable to meet demand, second hand prices have risen, he thinks, by 15 to 20 per cent and people are coming to his Underground Bicycles with old frames that would usually not be worth repairing. The market for spare parts has also “gone crazy”, he said, with some generic components all but unavailable in the UK, let alone their more reliable branded versions. “I just got 20 seven-speed freewheels . . . I paid double what I would have liked to.” Cycling’s soaring costs is one of many instances where the pandemic has fuelled consumer demand, disrupted supply chains and made it harder for businesses to operate, pushing up consumer prices. The question now is whether broader inflationary pressures will build as the UK economy reopens — with many consumers ready to spend amassed savings and many businesses still unable to operate at full capacity. So far, price rises have been patchy. Haircuts cost more after salons reopened last July, besieged by customers but burdened by personal protective equipment costs and social distancing requirements. Remote working appears to have driven up prices for data processing equipment. Second hand cars are selling for more because supply is down, with people delaying replacing their vehicles. But these have been balanced by similarly sharp price falls in areas where demand has slumped — for office clothing, women’s shoes or, Office for National Statistics data reveal, pregnancy tests. Research published by the London School of Economics shows that prices have been more volatile in the past year than at any point in the last 20. But the measure of consumer price inflation targeted by the Bank of England stood at just 0.7 per cent in January, even after adjustments by the ONS to take account of the way lockdowns have skewed spending. Now, the dynamics are changing. Andrew Bailey, Bank of England governor, told the BBC on Monday that inflation would start to rise towards the central bank’s 2 per cent target in the next two to three months, but that he saw “no evidence” to suggest it would rise to the 4 or 5 per cent level that could threaten price stability. Andy Haldane, the BoE’s chief economist, however, warned last month that in future inflation could “behave very differently than in the past”, and in the UK could overshoot its target for a sustained period, proving hard to tame. “It does feel as if the risks are shifting towards the upside,” said Paul Dales, of consultancy Capital Economics. He argued that higher global prices for oil, agricultural commodities and shipping could help push UK inflation above 2 per cent by year end. But these effects will be temporary, and offset by a stronger pound curbing import costs. The real issue is how far spending surges as restrictions ease, and how far companies are able to meet demand without raising prices. People are already paying exorbitant prices for holiday lets while some pub gardens are booked out for weeks after their earliest possible opening date in April. Wedding venues will probably be able to name their price when couples are finally able to marry. “We will see some extraordinary price increases at the top end,” said Richard Davies, economics professor at Bristol university and author of the LSE research, adding: “I normally go once a year to watch Wales play in Cardiff. I’m happy to pay £100. Now . . . I’m probably prepared to pay £200.” But both Davies and others think such price spikes will be shortlived. In a weak labour market, wage growth is unlikely to be strong enough to create lasting price pressures; and workers on low incomes — who are more likely to spend spare cash when they have it — are not the ones who have built up savings over the past year. “There will be lots of business out there who will feel the need to keep price hikes modest to get people through the doors,” Dales said. “How many haircuts can you have?” asked Sandra Horsfield, economist at investment bank Investec. “Ultimately, we are still in a situation where a lot of what the economy is seeing is sheltered by the government stepping in. The bigger question is what will happen once we are through all of this.” The BoE is unlikely to worry about temporary mismatches of demand and supply as the economy reopens. As Bailey signalled last week, the risk is of a more persistent hit to supply, if structural changes such as the shift to remote working and online retail leave people with the wrong skills for the jobs available, or if companies’ capital is tied up in the wrong locations.

No one knows how this will play out: there is a wide range of estimates for the degree of permanent damage to the UK’s potential output — the amount the economy can produce without fuelling inflation. Nor will it be easy to measure inflation. From airfares to cinema tickets, the ONS has been unable to collect prices over the past year as it usually would, and consumer spending patterns have been far from typical. What is clear is that the headline rate of inflation is increasingly unlikely to reflect individuals’ experience. This is not only because essentials such as food and energy make up a bigger share of spending for poorer households, while those on higher incomes spend more on services. Davies noted that the spread of prices the ONS collects for many items it tracks had widened. Thirty years ago, most pubs charged around 80p for a pint of bitter: now, a £2 pint is typical but the range goes to £6. This holds for many other items. “The problem of using one number is getting bigger over time,” he said. “People in Britain face very different rates of inflation and essentially live different economic lives.”


Rates may have to rise sooner to tame inflation threat, says Bank economist

 https://www.theguardian.com/business/2021/feb/26/rates-may-have-to-rise-sooner-to-tame-inflation-threat-says-bank-economist


Central bank complacency risks letting the “inflation tiger” out of the bag, a senior Bank of England policymaker has said.

Adding to market jitters about the resurgence of price pressures as the global economy recovers from the Covid-19 pandemic, Andy Haldane said borrowing costs could need to go up sooner than the City expected to tame the inflationary threat.

Threadneedle Street’s chief economist – who has been the most optimistic of the nine members of the Bank’s rate-setting monetary policy committee – said the low-inflation era of the past few decades may be coming to an end.

Other MPC members believe rising unemployment and business failures will ensure that inflation remains close to its official 2% target in the coming years, but Haldane said a smaller workforce, the retreat from globalisation, the stimulus provided by central banks, and the boost to consumer spending generated by running down savings would combine to push up the cost of living.

“Inflation is the tiger whose tail central banks control,” Haldane said in a speech. “This tiger has been stirred by the extraordinary events and policy actions of the past 12 months. It is possible that, as vaccinations are rolled out and some degree of normality returns, inflation will return to a stable state of rest. Indeed, if risks from the virus or elsewhere prove more persistent than expected, disinflationary forces could return.

“But for me there is a tangible risk inflation proves more difficult to tame, requiring monetary policymakers to act more assertively than is currently priced into financial markets. People are right to caution about the risks of central banks acting too conservatively by tightening policy prematurely. But for me the greater risk at present is of central bank complacency allowing the inflationary big cat out of the bag.”

Interest rates – or yields – on government bonds have risen this week as investors have demanded greater insurance against the risk of inflation. Haldane recently said in a newspaper article that the economy was like a “coiled spring” ready to go off, and his comment that the risks to inflation were skewed to the upside pushed the pound higher on the currency markets. He said there were “good grounds” for believing future inflation could behave very differently than in the past.

The MPC’s collective position is that policy will not be tightened until there is clear evidence that the economy has made up the ground lost during the pandemic and the inflation target has been sustainably met.

Haldane said: “My judgment is that we might see a sharper and more sustained rise in UK inflation than expected, potentially overshooting its target for a more sustained period, as resurgent demand bumps up against constrained supply.”

Financial markets globally had recently begun pricing in this possibility, he added.

Also speaking on Friday, the Bank of England deputy governor, Dave Ramsden, said the risks to UK inflation were broadly balanced. “When I look at the UK, I see inflation expectations – whatever measure you look at – well-anchored,” he said, following a speech to the Institute of Chartered Accountants in England and Wales.


2021年2月21日 星期日

Asset managers rush to shore up portfolios against inflation

 https://www.ft.com/content/afc414f9-c6a1-4f37-afab-276d98973a09


Investors are asking tough questions of money managers as concerns rise that stock market could suffer


Signs that inflation is making a comeback are unsettling big investors. Past periods of high inflation have weighed heavily on real returns from stocks and bonds, which have flourished over the past decade when inflationary pressures have generally remained muted. But inflation forecasts are now rising following massive increases in government spending and the torrent of liquidity unleashed by central banks in response to the coronavirus pandemic. Asset managers are now facing a barrage of questions from clients over the risks of inflation and are rushing to shore up portfolios from inflationary risks, fearing that a resurgence threatens to spoil the party again for investors.  “Inflation is an escalating concern among institutional investors,” said Michael John Lytle, chief executive of Tabula, a London-based ETF provider. The IMF forecast in October that the average annual inflation rate in advanced economies will double from 0.8 per cent last year to 1.6 per cent in 2021. Citigroup, meanwhile, estimates that global inflation will increase from last year’s average of 2 per cent to 2.3 per cent this year. Recent price developments in commodity markets also suggest inflationary pressures are intensifying. Brent crude, the international oil benchmark, has surged from about $20 a barrel in late April to more than $60 a barrel. JPMorgan Chase is forecasting that crude prices could reach $100 a barrel, a level not reached since 2014. Copper, the world’s most important industrial metal, has reached an eight-year high above $8,400 a tonne, up more than 70 per cent from its low last March. Ugo Montrucchio, head of multi-asset investments for Europe at Schroders, said clients of the £526bn UK asset manager were asking “more and more questions about inflation”.


“Inflation is at the forefront of the minds of our large institutional clients but less so for retail investors,” said Montrucchio. He has been increasing allocations to commodities, US financial stocks and short-term government bonds as hedges against rising inflation.  Policymakers have signalled that they will not respond to rising inflation by tightening monetary policy until there is clear evidence that the global economy is making a sustainable recovery from the disruption caused by coronavirus. Central banks have injected $6.6tn in liquidity into financial markets since March as the pandemic gained pace globally, according to CrossBorder Capital, a London-based consultancy. It expects central banks to provide at least another $5.8tn in additional liquidity as policymakers fulfil pledges that they have already made. “Central banks stand ready to increase liquidity provision beyond what is already in the pipeline, if needed,” said Michael Howell, chief executive of CrossBorder Capital. Rupert Watson, head of asset allocation at Mercer, the consultant, says governments will allow their economies to run hot to aid recovery from the pandemic and that will also push up inflation. “The global economy is receiving a massive fiscal and monetary boost. We do not expect that inflation will rise as high as 5 per cent but the risks are changing. We are encouraging clients to think about the inflation sensitivity of their entire portfolios so that they can withstand a range of outcomes,” said Watson. The Federal Reserve has indicated that it has no intention of changing its monetary stance until inflation is on track to exceed its 2 per cent target and the jobs market is approaching “maximum employment”, a dual objective that is not expected to be achieved in the near term. Investors have taken note of the Fed’s guidance and priced in both higher inflation and a robust rebound in economic activity later this year. This has led to the yield on the benchmark US 10-year Treasury bond rising from 0.72 per cent at the start of September to about 1.3 per cent. President Joe Biden wants Congress to approve a $1.9tn fiscal stimulus bill in order to accelerate the US economy’s recovery from coronavirus. Republicans oppose Biden’s plans and Lawrence Summers, who served as Bill Clinton’s Treasury secretary, has warned that the additional spending could trigger “inflationary pressures of a kind we have not seen in a generation”. In the US, headline annual consumer price inflation was running at just 1.4 per cent in January. But recent increases in energy and food prices have driven up inflation expectations among consumers. The University of Michigan published a widely watched survey which indicates that consumers expect US inflation to reach 3.3 per cent over the next 12 months, the highest reading since 2014. Lori Heinel, deputy global chief investment officer at State Street Global Advisors, the third-largest asset manager in the world, said questions about inflation had been raised by clients in every investor meeting this year. “The big question that clients want to discuss is whether the stock market could get dragged down by an increase in bond yields as a result of inflation pressures. But history shows that a moderate increase in inflation that is due to stronger economic activity can be good for equities,” said Heinel.


2017年7月24日 星期一

Salient Features of Bull Market Peaks - John P. Hussman, Ph.D.

https://www.hussmanfunds.com/wmc/wmc170724.htm

All rights reserved by John P. Hussman, Ph.D.

Last week, the S&P 500 price/revenue ratio reached the highest level in history, outside of the single week of March 24, 2000 that represented the peak of the tech bubble. Meanwhile, the 30-day CBOE volatility index (largely reflecting the level of fear or complacency among option traders) dropped to a record low, as bullish sentiment surged to 57.8% bulls versus 16.7% bears (Investors Intelligence), and the S&P 500 pierced its upper Bollinger bands (two standard deviations above a 20-period moving average) on daily, weekly, and monthly resolutions.
Today’s offensive valuations establish the likelihood of zero or negative S&P 500 total returns over the coming 10-12 year horizon, and steep interim market losses over the completion of the current market cycle, but those are long-term and full-cycle considerations. From the standpoint of shorter segments of the market cycle, it’s equally important that aside from wicked market overvaluation and the most extreme overvalued, overbought, overbullish syndromes we identify, we also continue to observe dispersion across our measures of market internals (which we use to infer changes in the inclination of investors toward speculation or risk-aversion).
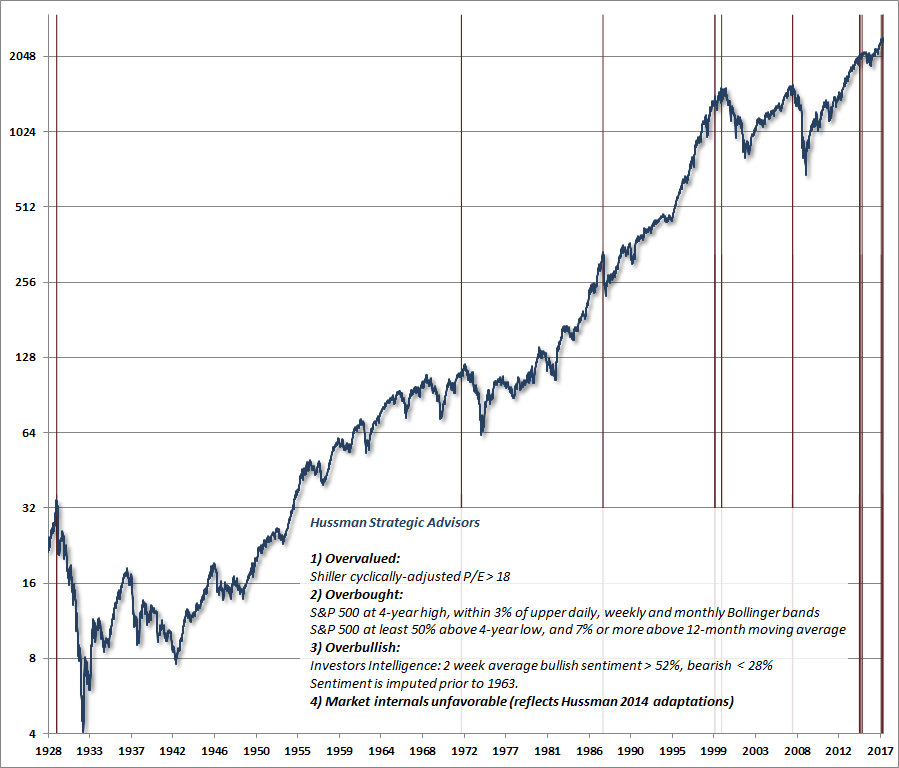
I’ve extensively detailed how the Federal Reserve’s deranged pursuit of zero interest rates in the recent half-cycle disrupted the historical reliability of “overvalued, overbought, overbullish” syndromes as sufficient indicators of imminent, steep, and abrupt market declines. In the presence of zero interest rates, one had to wait for market internals to deteriorate explicitly, before adopting a hard-negative outlook. See When Valuations Don’t Seem to “Work” for a review of that narrative, the challenges it created for us in the recent half-cycle, and how we adapted. Take a moment to review the chart that appeared at the bottom of that commentary. The only addition to that chart is that the S&P 500 has now extended this advance enough to pierce its upper Bollinger bands at daily, weekly, and monthly resolutions.
There are many conditions that differ at various market peaks across history, including the behavior of interest rates, economic measures, inflation and other factors. For example, core inflation was just 2% and falling at both the 2000 and 2007 peaks. Credit spreads were low and falling at the 1966, 1972, and 1987 market peaks. We do find that rising credit spreads are among the conditions that generally accompany recessions, but they can emerge well after the stock market sets its high. Indeed, even for bear markets that are associated with recessions, convincing evidence of a recession typically does not emerge until well into those declines.
Given various factors that are observable at each point in time, the central question is always whether they are salient, in the sense that they project outward, modifying or dominating other conditions enough to systematically affect subsequent market outcomes.
We know, for example, that low interest rates and Fed easing are actually salient only to the extent that they are consistent with the behavior of market internals (see When Fed Easing Helps Stocks, and When It Doesn’t. When market internals are uniformly favorable across a broad range of securities and asset classes, Fed easing strongly amplifies the bullish tendencies of the market, particularly when valuations are favorable, or "overvalued, overbought, overbullish" syndromes are absent. By contrast, as long as market internals remain uniformly favorable, even Fed tightening is associated with market gains, on average. Conversely, when market internals are unfavorable or feature internal dispersion, as they did through 2000-2002 and 2007-2009 market collapses, even the most aggressive and persistent easing by the Fed does not support stocks. Indeed, when market internals are uniformly unfavorable, market losses are worse when the Fed is easing than when it is not.
The explanation for the market’s conditional response to Fed easing is straightforward. Uniformly favorable market internals are a signal that investors are inclined to speculate and accept market risk. In that environment, low-interest liquidity is viewed by investors as an inferior asset and a “hot potato.” Creating a larger pool of these inferior assets contributes to even greater yield-seeking speculation.
In contrast, as investors ought to remember from 2000-2002 and 2007-2009, once investors become risk-averse, low-interest liquidity is viewed as a desirable asset. In a risk-averse environment, creating safe, low-yielding liquidity is quite welcome, but does nothing to encourage risk-seeking behavior. In fact, the market experiences particularly steep losses when the Fed eases during “risk-off” conditions, because that easing is typically a response to ongoing economic deterioration.
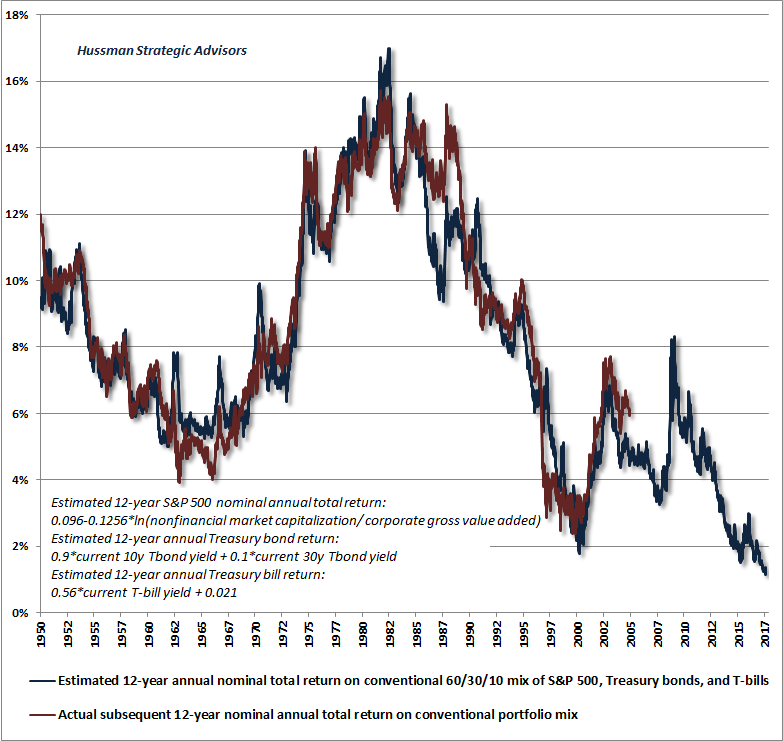
In recent years, the interplay between Federal Reserve’s deranged zero-interest rate policies and investor risk-preferences has created a race to extremes from the standpoint of valuations, and a race to the bottom from the standpoint of future return/risk prospects for the financial markets. Our estimates of prospective 12-year total returns on a conventional mix of 60% S&P 500, 30% Treasury bonds, and 10% Treasury bills fell to the lowest level in history last week (chart below), reflecting the third financial bubble since 2000, with the broadest scope of any speculative episode in U.S. history.
There is no evidence that the Federal Reserve’s creation of trillions of dollars of zero-interest base money did anything to stimulate the economy in recent years. Indeed, the trajectory of the economy since 2009 has been no better than the path that could have been projected based strictly on prior values of non-monetary variables (See Failed Transmission: Evidence on the Futility of Activist Fed Policy). The main effect of the Federal Reserve was to intensify the speculative inclinations of investors by recklessly pouring fuel over a frantic, yield-seeking blaze.
It is a terrible mistake to ignore the current status of market internals, particularly in extremely overvalued (or undervalued) market conditions, because the response of the market to Fed easing or tightening is strongly determined by whether investors are inclined toward speculation or risk-aversion at the time.
Again, our very challenging lesson in the recent half cycle was that in the face of unprecedented zero interest rate policies, even extreme “overvalued, overbought, overbullish” syndromes (which had been reliable in prior market cycles across history) didn’t matter either. In the presence of zero interest rates, one had to wait for market internals to deteriorate explicitly before adopting a hard-negative outlook. The half-cycle since 2009 would have been dramatically different for us with that single adaptation. But to ignore the present combination of offensive market valuations, extreme overvalued, overbought, overbullish syndromes, and already unfavorable market internals, is to entirely ignore the central lesson of this half-cycle, to ignore the ineffectiveness of Fed easing during 2000-2002 and 2007-2009, and to instead assume that market cycles have simply been repealed.
Examine your exposure to market risk
On the measures we find most tightly correlated with actual subsequent market returns across history (see the table in Exhaustion Gaps and the Fear of Missing Out for a comparison of the reliability of numerous alternative measures), the S&P 500 is now between 150% and 170% above valuation norms that have been approached or breached over the completion of every market cycle in history, including the most recent one. Allowing for a lesser retreat ending about 25% above those norms (which is the largest distance ever remaining by the completion of any cycle across history, even those associated with quite low interest rates), we fully expect the S&P 500 Index to lose between 50-63% as this speculative episode unwinds.
The midpoint of that range is about 56% below present level of the S&P 500, about 53% below the 2016 high, about 50% below the 2015 high, and about 49% below the 2014 high. Do investors really imagine that any of the market gains in recent years will have made a difference by the completion of this cycle? There is a distinction between transient returns and durable returns that are actually retained by investors over the complete cycle. A central lesson of value-conscious investing, validated across the entirety of market history, is that durable market gains are associated with market advances toward historically normal valuations, while advances that move beyond historically normal valuations are nearly always transient (see Durable Returns, Transient Returns for a reminder of how this works).
As I observed in 2007, once extreme valuations are established, a full-cycle perspective becomes essential, and the market becomes ultimately very forgiving of early exit. Recall that the 2000-2002 decline wiped out the entire total return achieved by the S&P 500, in excess of Treasury bills, all the way back to May 1996, while the 2007-2009 decline wiped out the market's entire total return, in excess of Treasury bills, all the way back to June 1995.
Just as in 2000 and 2007, the fear of missing out may be keeping investors from taking actions to bring their exposure to market risk in line with their true risk tolerance and capacity for loss. Investors should think carefully, now, about their true investment horizon and their willingness to maintain a passive discipline should severe interim market losses emerge in the coming years, on the way to zero or negative overall 10-12 year market returns.
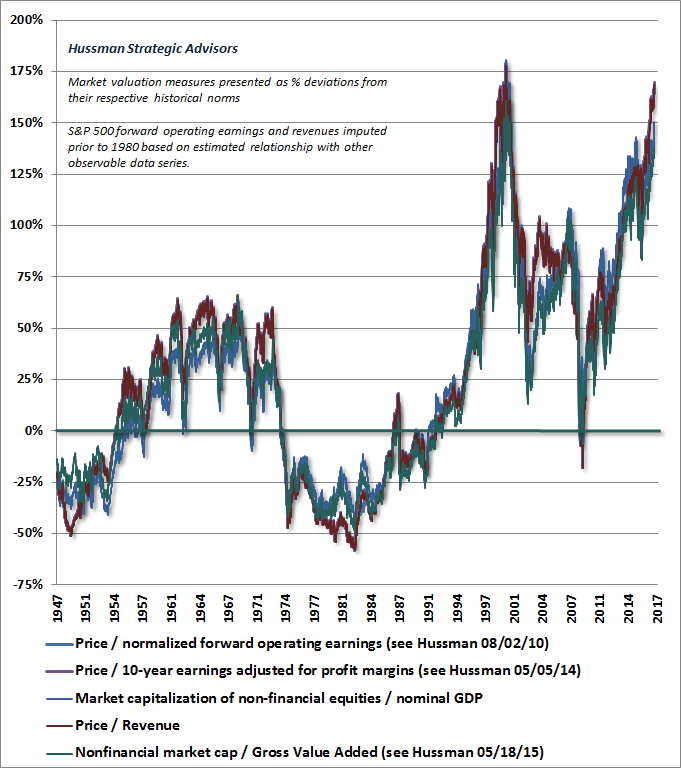
The salient features that have accompanied the most extreme peaks in the U.S. stock market across history, and the steepest subsequent losses, are already in place. These include offensive valuations on historically reliable measures, lopsided bullish sentiment, deteriorating uniformity across market internals (indicating a subtle shift toward increasing risk aversion among some classes of investors), and overextended market action (with the S&P 500 at record highs, pushing to upper Bollinger bands at daily, weekly, and monthly resolutions). The confluence of these salient conditions does not prevent further speculative extremes, and it always remains possible that the uniformity of market internals will improve in a way that signals a fresh willingness among investors to embrace risk and further extend this speculative episode. In the meantime, however, our value-conscious, historically-informed, full-cycle investment discipline provides us with no basis to join that speculation.
We don’t rely on a market peak here, but we see every reason to view an abrupt conclusion of this advancing half-cycle as probable, even imminent, and no salient reason to rule it out. The fundamental instabilities are already present, like open buckets of gasoline in an explosives warehouse. So called “catalysts” often become evident only after the fact, and sometimes remain obscure, as they did in 1987.
A few side notes. We also observe other features that are consistent but certainly not necessary for a market peak. These include a log-periodic Sornette-type structure that will reach its estimated “finite-time singularity” as early as this week (see Wrecking Ball for a recent chart, and Sornette’s book Why Stock Markets Crash for mathematical detail). I’ll emphasize again that Sornette’s work does not incorporate fundamentals, and is based purely on a mathematical “log-periodic power-law” structure. While speculative bubbles across many markets and countries have fit that structure well, we track Sornette’s approach only for informational purposes, and the analysis does not drive our own discipline. The last such structure was in late-2013/early-2014, which turned out to be an “inflection point” that marked the cyclical peak in year-over-year momentum, but not in price. What makes the current structure interesting here is mainly that it overlaps extremes in our own work.
I’ve also been asked to comment on a recent paper analyzing the Shiller cyclically-adjusted P/E, which proposes an elaborate statistical method to form projections of expected market returns. Specifically, the approach fits an unrestricted 60-parameter vector autoregression, which further embeds a 12-parameter inflation model, ignores the impact of embedded profit margins, and after all that, underperforms the projections that one could obtain simply by using the ratio of nonfinancial market capitalization to corporate gross value added (MarketCap/GVA) with no regressions or fitted parameters whatsoever. I suspect that this description is sufficient to convey my reservations about this particular method. That’s no slight to the researchers. It’s just that we know that the Shiller CAPE, despite the 10-year averaging of earnings, is still sensitive to the embedded profit margin (the denominator of the Shiller P/E divided by S&P 500 revenues), and that accounting for that embedded margin clearly improves the correlation of the CAPE with actual subsequent market returns (See Margins, Multiples and the Iron Law of Valuation), without any need to fit scores of parameters.
On that note, it’s worth noting that the Shiller CAPE reached 30 last week, which places current valuations among the highest 3% of historical observations, on that particular measure. In reality, however, the situation is much more extreme. While some observers take solace in the fact that the CAPE reached a much higher level of 44 at the 2000 bubble peak, that historical comparison ignores the embedded margin. See, at the 2000 peak, the embedded margin of the CAPE was just 5.1%, compared with a historical norm of 5.4%. At present, because of depressed wages and high profit margins in recent years (which are now reversing given a 4.4% unemployment rate), the CAPE quietly embeds a profit margin of 7.2%. Put another way, investors are currently paying a very high multiple of a very high earnings number that quietly benefits from cyclically elevated profit margins. On the basis of normalized profit margins (an adjustment that improves historical reliability), the normalized CAPE would presently be 40. There is only a single week in history where the normalized CAPE was higher. That was the week of March 24, 2000, when the S&P 500 hit its final bubble peak, at a normalized CAPE of 41.
The foregoing comments represent the general investment analysis and economic views of the Advisor, and are provided solely for the purpose of information, instruction and discourse. Please see periodic remarks on the Fund Notes and Commentary page for discussion relating specifically to the Hussman Funds and the investment positions of the Funds.
---
Prospectuses for the Hussman Strategic Growth Fund, the Hussman Strategic Total Return Fund, the Hussman Strategic International Fund, and the Hussman Strategic Dividend Value Fund, as well as Fund reports and other information, are available by clicking "The Funds" menu button from any page of this website.

Estimates of prospective return and risk for equities, bonds, and other financial markets are forward-looking statements based the analysis and reasonable beliefs of Hussman Strategic Advisors. They are not a guarantee of future performance, and are not indicative of the prospective returns of any of the Hussman Funds. Actual returns may differ substantially from the estimates provided. Estimates of prospective long-term returns for the S&P 500 reflect our standard valuation methodology, focusing on the relationship between current market prices and earnings, dividends and other fundamentals, adjusted for variability over the economic cycle (see for example Investment, Speculation, Valuation, and Tinker Bell, The Likely Range of Market Returns in the Coming Decade and Valuing the S&P 500 Using Forward Operating Earnings ).